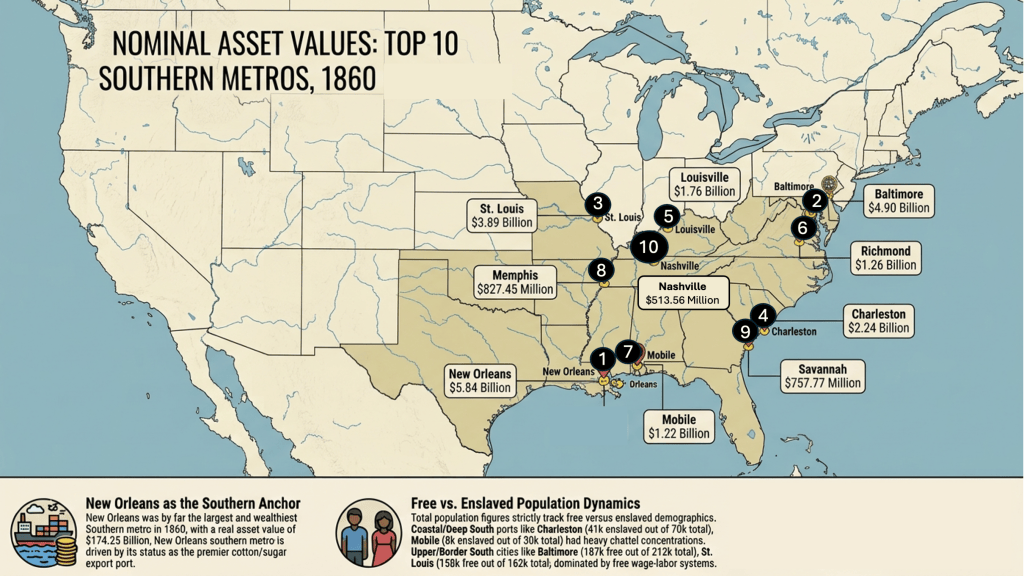
[BOT Report]
Asset Value Analysis (AVA) provides a powerful, multi-scalar framework that bridges long-standing divides in economic history, institutional economics, and global macro-sociology. By synthesizing Partha Dasgupta’s multi-capital accounting framework (natural, human, physical, and social capital) with Immanuel Wallerstein’s World-Systems Analysis, this long-run global asset map (3500 BCE to 2020 CE) makes several crucial contributions to contemporary scholarship:
1. Reconciling Quantitative Econometrics with Qualitative “New Histories of Capitalism”
For decades, economic history has experienced a tension between quantitative cliodynamics/Maddisonian GDP reconstructions and qualitative historical analyses (e.g., Sven Beckert, Walter Johnson, Edward Baptist).
- The Contribution: GDP measures only annual flow, often obscuring structural extraction, wealth accumulation, and uncompensated labor. By focusing on the aggregate capital stock envelope and incorporating a Micro-AVA beneficial ownership metric, the model quantifies how capital flows were historically extracted from enslaved, indigenous, and colonized populations to capitalize European and North American asset expansion.
2. Operationalizing World-Systems Theory Across Deep Time (3500 BCE – 2020 CE)
Wallerstein’s World-Systems Theory effectively explains core-periphery dynamics, but often lacks a continuous, empirical unit of measurement for imperial transitions prior to the 16th century.
- The Contribution: By applying an index-linked deflator and tracking spatial network friction across pre-modern, early modern, and modern eras, the map establishes a single, continuous benchmark. It charts the geographic migration of primary global asset density—from early riverine cores (Mesopotamia, Egypt) to the Gangetic Plain, Mediterranean, Song China, Pax Britannica, and ultimately the 20th-century American Sunbelt shift—demonstrating how spatial integration directly scales capital valuation multipliers.
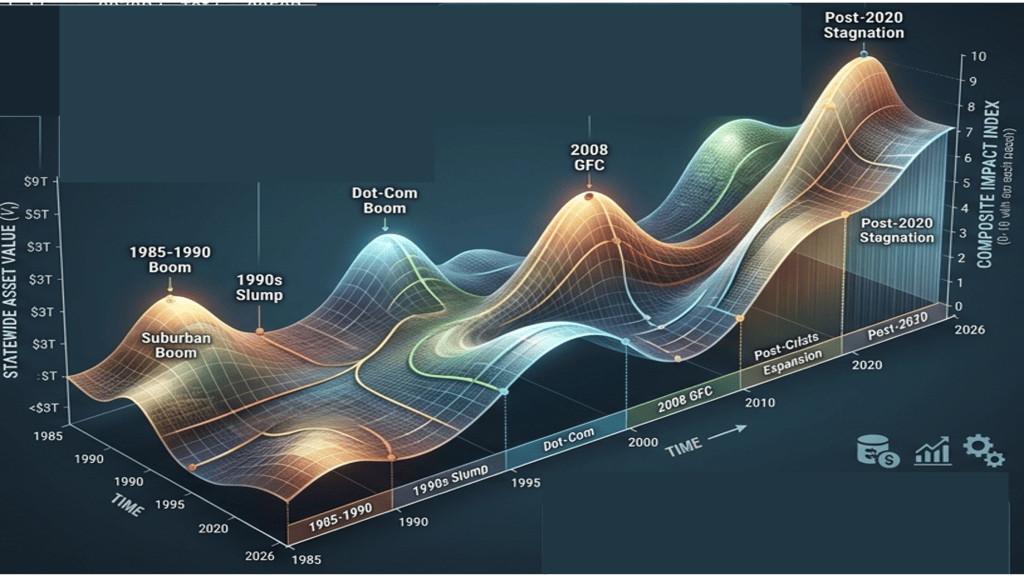
Image 2. Using a manifold to track the evolution of California as a market economy shows more detail about contraction and expansion in the context of multiple historical causes.
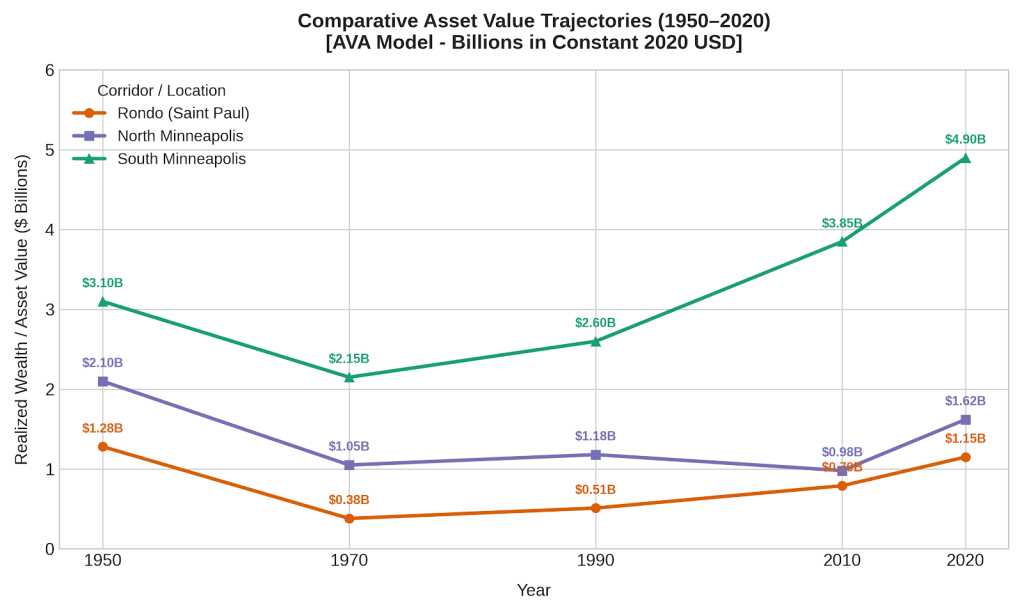
Image 3. A first look at the econometric impact of asset loss, stagnation, and growth in Minnesota’s three largest African-American communities, 1950-2020.

Image 4. Comparative historical manifolds show new dimensions of spatial urbanism, economic expansion, and macroeconomic impact on the evolution of the Twin Cities, 1950-2020.
/
BOT reports use extensive original research, Google tools, Adobe tools, MS-Office, and original coding to synthesize graphics and text for public engagement.


Leave a Reply