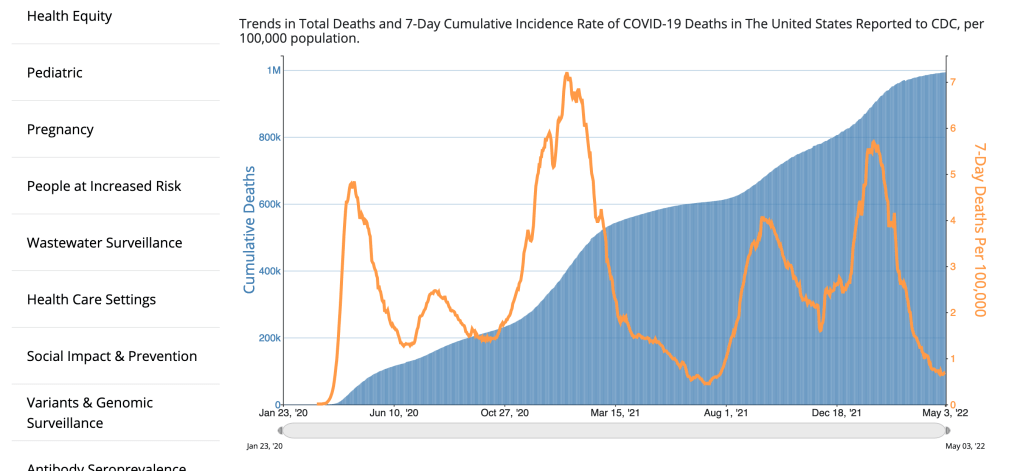
With new headlines emphasizing 1 million deaths in the US, everyone should take a look at this chart showing the actual data about those deaths.
What do you see?
What do you think?
What do you wonder?
With new headlines emphasizing 1 million deaths in the US, everyone should take a look at this chart showing the actual data about those deaths.
What do you see?
What do you think?
What do you wonder?

Leave a comment